Analysis & Recommendations
Please find below the process used to analyze the dataset. All graphs have been created using Matplotlib and Seaborn
Data Cleaning
This state consists of cleaning and preprocessing data in order to prepare it for modeling
- Start by reading the file using read_csv in pandas. Drop any unnecessary columns to focus on important data needed for analysis. Currently columns Id, sentiment score, sentiment confidence and the tweet content were retained.
- Look for nulls within the dataset. Any nulls withing the sentiment confidence/score can be replaced using mean of the remaining data in the score/confidence columns.
- Look for nulls within the dataset. Any nulls withing the sentiment confidence/score can be replaced using mean of the remaining data in the score/confidence columns.
- Some of the emoticons create weird symbols within the dataset and in order to remove them we would encode the twitter data to ascii and then decode this ascii data
- Use regex to remove unnecessary content that do not provide any value while extracting sentiment. This includes URL's, emails, new line characters, distracting single quotes and usernames.
- Analyze hashtags to see if they are useful. Since we have a lot of hashtags we find the count of words in hashtags to sort through the large amounts of data. We find that few words like wow, innovation, scary, crazy can be used for sentiments but the number is small (5%) so we'd rather eliminate all hashtags for easier processing since over 95% of the hashtags do not provide any valuable insight
Basic analysis
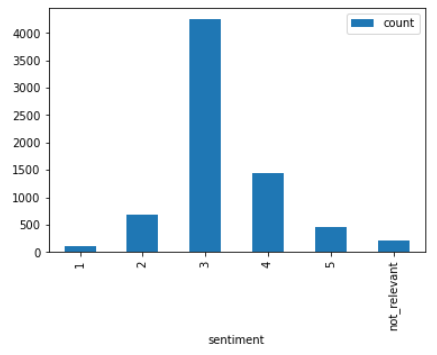
Use a barplot to depict sentiment scores to understand the distribution better. From the graph below,
we see maximum concentration of data in the sentiment 3 section. This might result in us being able to predict data with sentiment 3 more accurately.
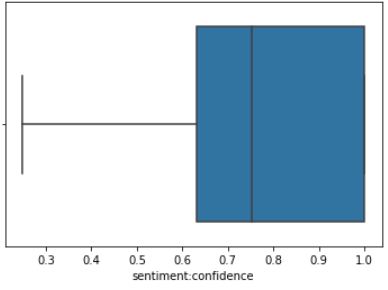
Outlier detection can be performed using a boxplot. On creating a boxplot using the sentiment confidence column, we note that while there are no apparent outliers, the scores are skewed towards the higher end which means that the confidence in the sentiment score column is pretty high which is a positive thing. Thus the sentiment score would be a good variable to predict future sentiments.
Packages Used:- Pandas, NumPy, Matplotlib
Tokenization
Tokenization is the process of breaking down text into smaller chunks of data for easier processing. We also need to perform lemmatization in order to reduce every word to its base root word. Perform tokenization using the tokenize function of nltk and create a custom Parts of Speech tagger in order to tag values as adjective, verb, noun and adverb and use these tagged values for lemmatization.
Lemmatization
In order to perform lemmatization, we use the lemmatizer function in nltk to lemmatize the tokenized dataset. Remove stop words and frequently occurring words that do
not add any value to sentiment. Create a list with all lemmatized words. Make 2 arrays one for lemmatized words and other for parts of speech tagging.
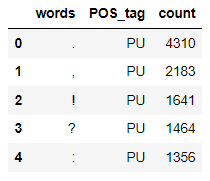
Create dataframe of lemma and parts of speech. Since we do not have a POS tagging for punctuation we add one called PU.
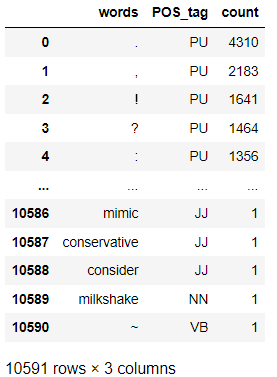
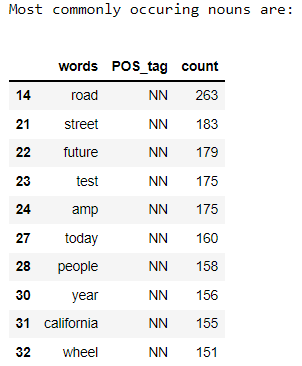
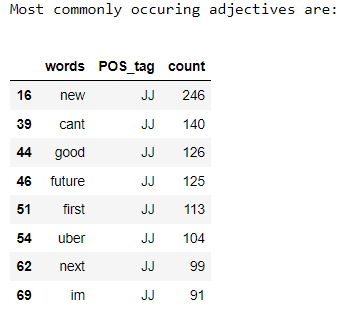
To find overall commonly occuring words we apply a filter of greater than 1000 occurences. We then find the most commonly occuring nouns, adjectives and punctuations in the dataset
Packages Used:- nltk and other packages mentioned above
In this stage we perform supervised classification on the twitter dataset in order to be able to predict accurate sentiments. The first step would be to detokenize the twitter data. We then split our dataset into training and testing data. Our next step would be vectorizing text reviews to a numerical format since classification cannot be performed on textual data. Finally, we perform classification using Multinomial Naive Bayes Classifier which produces an accuracy of 61.26%
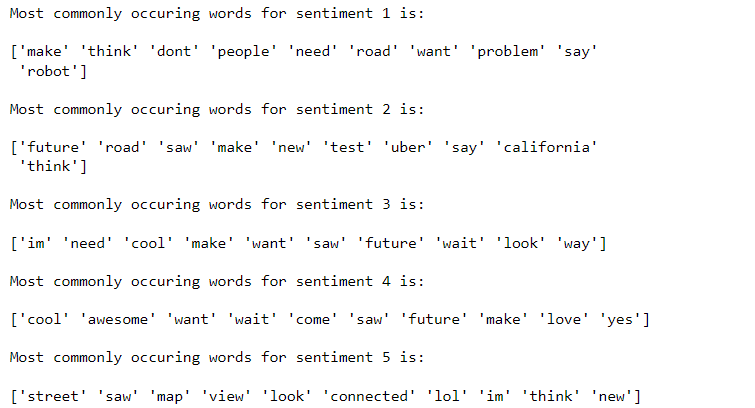
Now that we have our model ready, we want to find the top 10 words for each sentiment class in order to judge if our model gives meaningful results. For this we
will use the feature_log_prob_ function of sklearn to find feature importance
Packages Used:- sklearn and other packages mentioned above
Model Evaluation
As seen above, the accuracy of our Naive Baye's Classifier is 61.26%. We then test our predictions using random test statements as shown below.
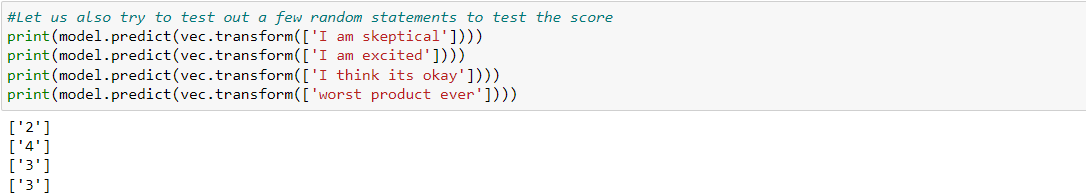
From the above scores we see that negetive words like skeptical are being given a low sentiment score while positive words like excited have a high sentiment score.
We would however assume that a word like "worst" would have a very low sentiment which is not the case. This is probably due to the lower accuracy
of the model or the large numbet of records under score 3 as shown in the EDA above
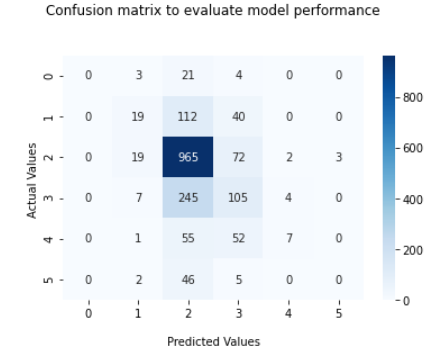
We use a confusion matrix to understand the performance of the model against each score.
The confusion matrix below shows the correlation between the actual and predicted values.
As shown above max correlation can be observed for sentiment score 2. Which means the accuracy for tweets with a sentiment score of 2 is the highest. This is a little
unexpected since as per our analysis, the distribution of sentiment score 3 was the highest.
Potential Methodologies to Improve Model Performance
A major issue in our model is that the accuracy is pretty low around 61.49%. We can improve our model by changing the way our bag of words is created. Currently it is created using the CountVectorizer method which counts the occurence of the words in the text. A word that appears frequently becomes more important for classification. To overcome this problem we can use TF-IDF, which considers the product of term frequency and inverse document frequency. If a term appears n times in a document with w words term frequency would be n/w. We can also try different models such as a Linear Support Vector Classifier
On implementing TFIdfVectorizer followed by Linear Support Vector Classifier we noticed the accuracy increase to 62%